Building a Digital Nation
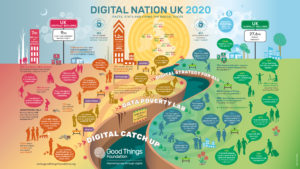
Each year Good Things Foundation create a Digital Nation infographic, gathering together the facts and stats about digital inclusion and exclusion in the UK. Find every infographic since 2016 on this page.
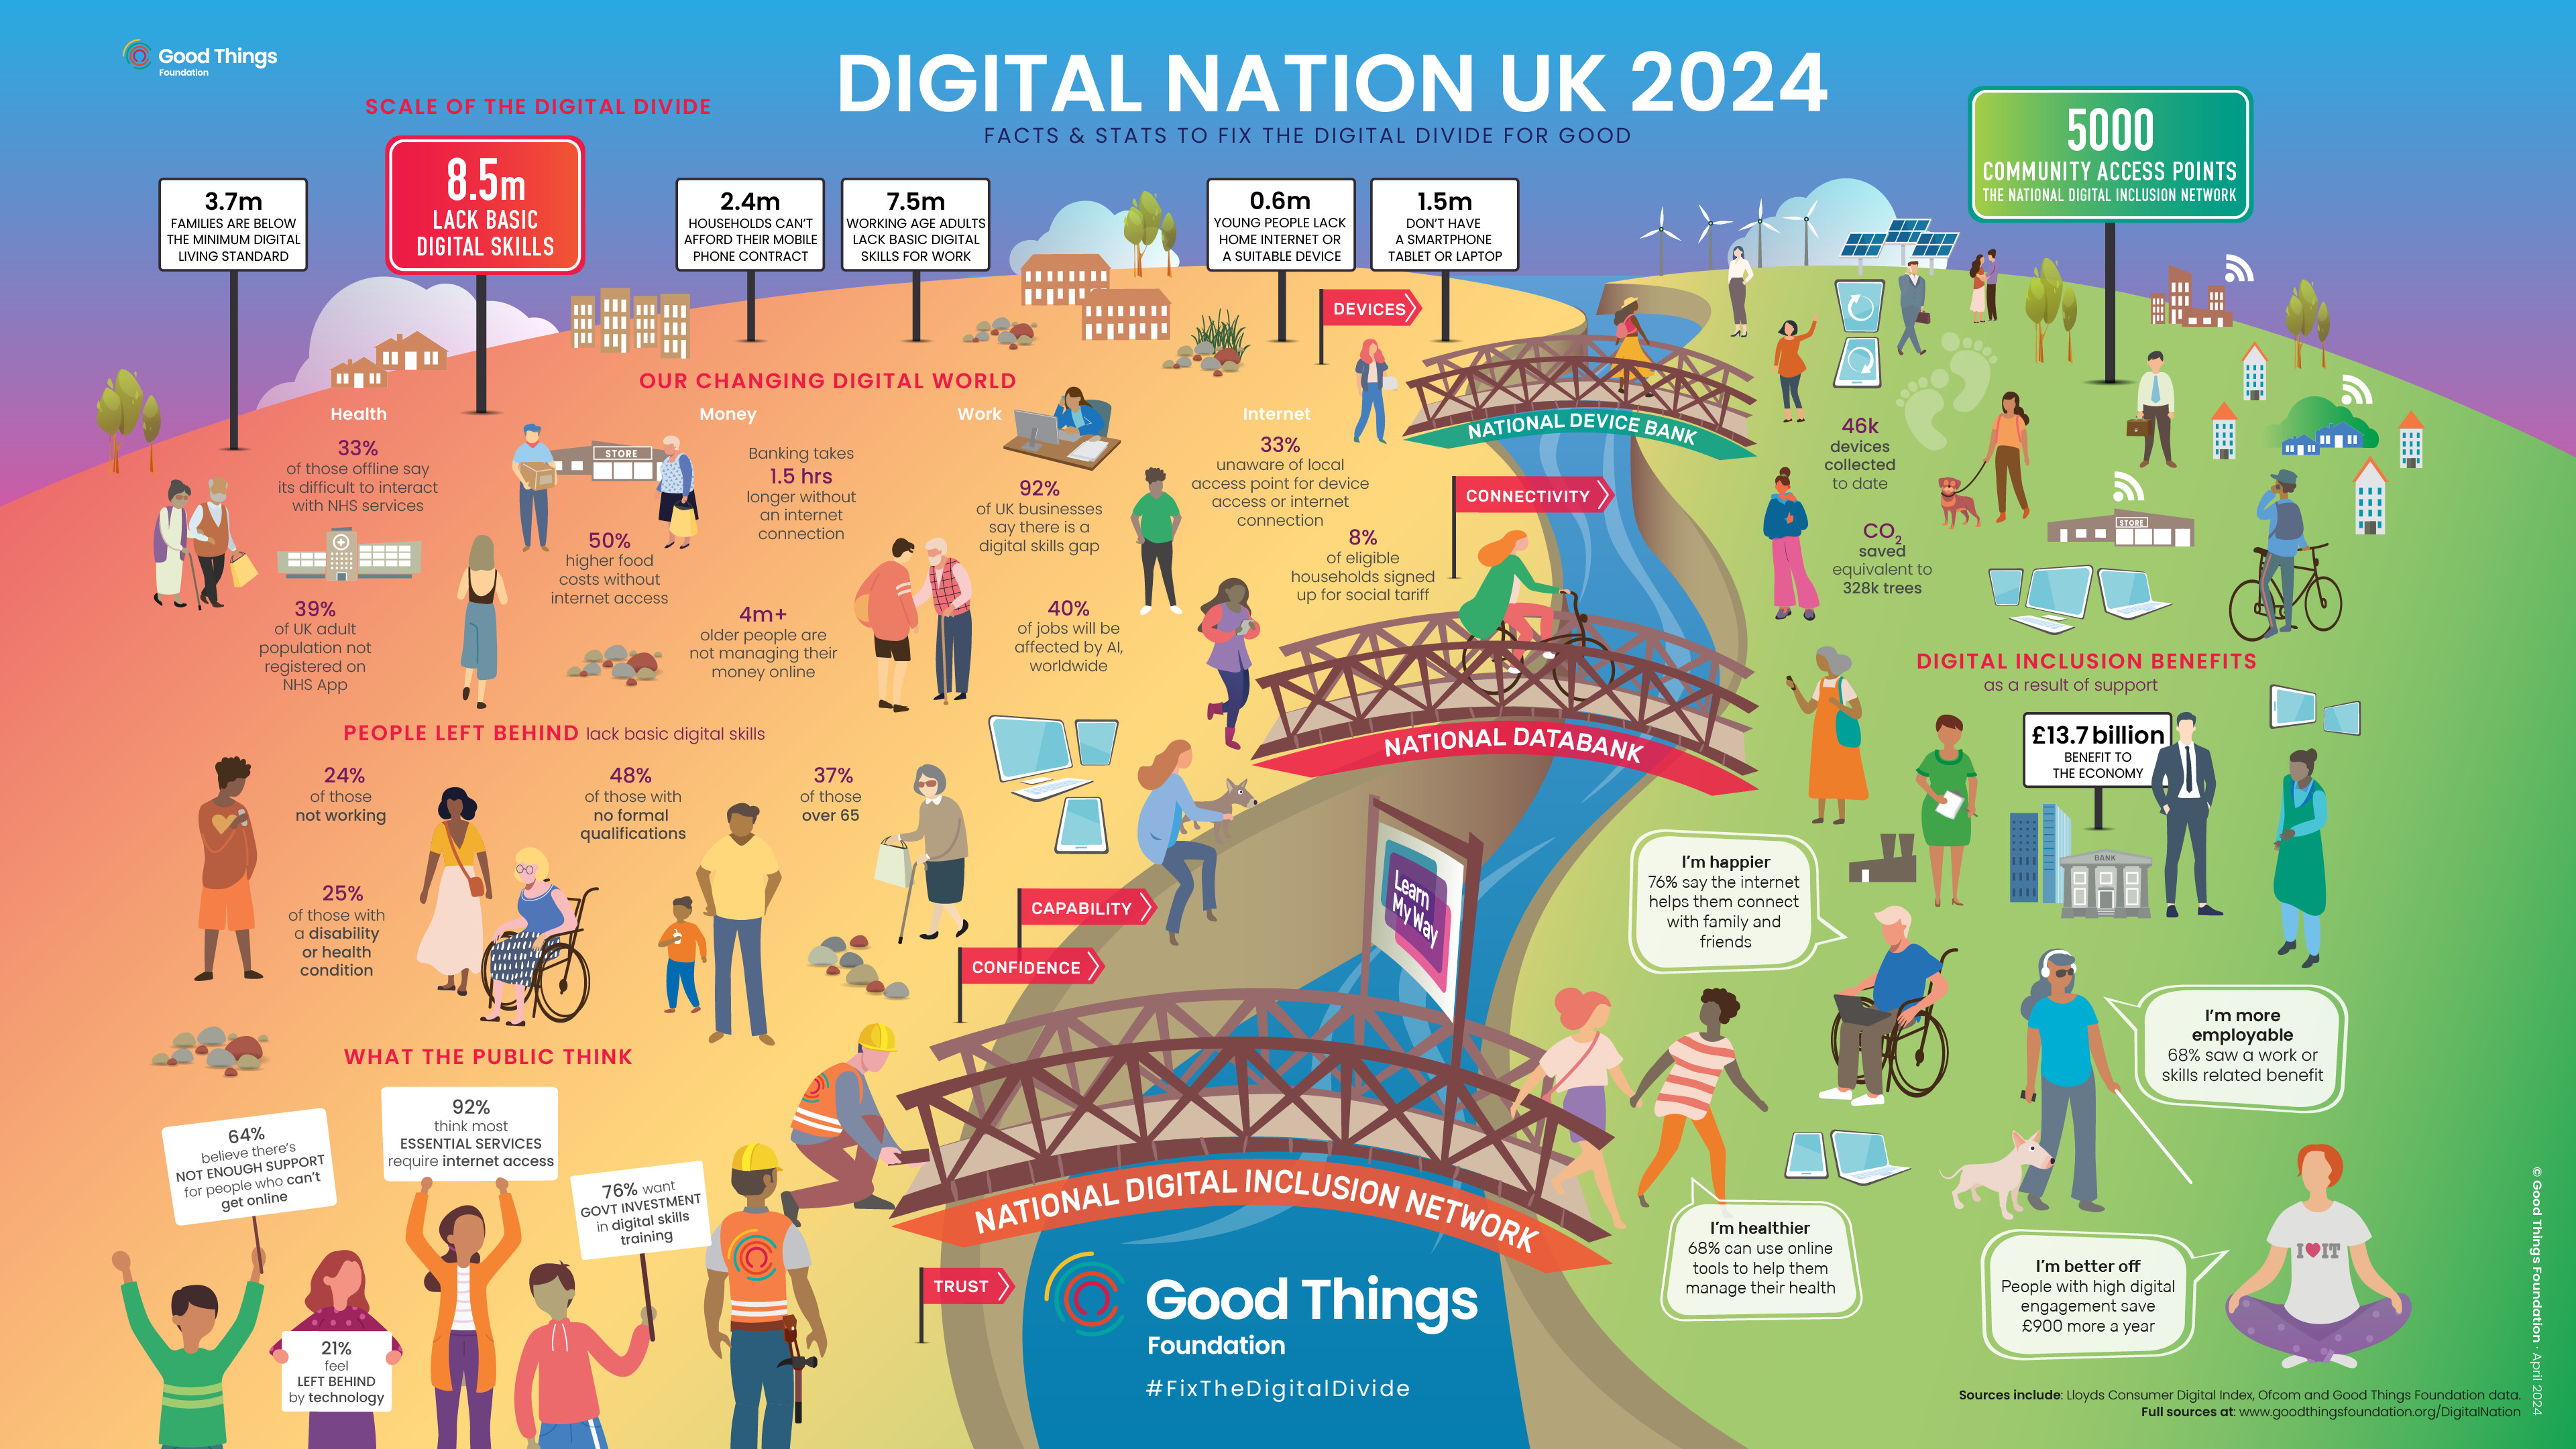
The 2024 update of our Digital Nation infographic gathers together the facts and stats about digital inclusion and exclusion in the UK. It uses updated analysis of the latest Ofcom data by Prof. Simeon Yates alongside key sources such as Ofcom’s Affordability of Communications Services research, Lloyds Banking Group’s UK Consumer Digital Index reports 2023, and data from research on ‘The Economic Impact of Digital Inclusion in the UK’ (Cebr 2022).
Together with our new Strategy 2022-25 – Fixing the Digital Divide for Good – the case for action is clear. Let’s work together to fix the digital divide for good so that everyone has the internet access they need, everyone have somewhere local to go for help to use the internet, and everyone feels able and safe in the online world. Through our National Digital Inclusion Network, National Databank and National Device Bank – we’re here to help make that happen.
Let’s #FixTheDigitalDivide together.
View the full list of sources used in our Digital Nation infographic, along with an explainer of how and why we’ve chosen to represent the digital divide in this way.
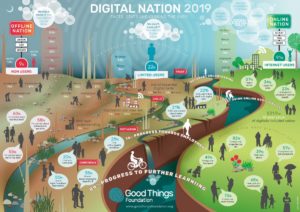
The 2019 update of our Digital Nation infographic gathers together the facts and stats about non, limited and engaged users of the internet in the United Kingdom. It looks at a range of areas including the barriers to getting online and the benefits to those who develop digital skills and fully embrace the digital world.
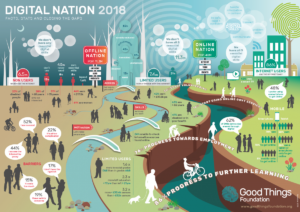
The 2018 update of our Digital Nation infographic gathers together the facts and stats about non, limited and engaged users of the internet in the United Kingdom. It looks at a range of areas including the barriers to getting online and the benefits to those who develop digital skills and fully embrace the digital world.
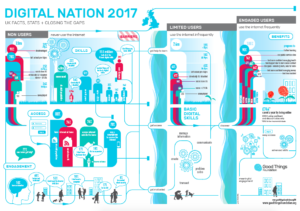
The 2017 update of our Digital Nation infographic gathers together the facts and stats about non, limited, and engaged users of the internet in the United Kingdom. It looks at a range of areas including the barriers to getting online and the benefits to those who develop digital skills and fully embrace the digital world.
We have also created a sources infographic to give you an overview of where the stats came from that formed Digital Nation 2017.
Download the Digital Nation 2017 sources infographic (PDF, 913KB)
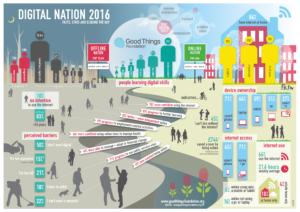
This 2016 update of the Digital Nation infographic gives an overview of the state of the online – and offline – nation. Here all the latest facts and stats on how to close the gap are presented in one graphic – find out who, what, why and how we get online in 2016.
We have also created a sources infographic to give you an overview of where the stats came from that formed Digital Nation 2016.
Download the Digital Nation 2016 sources infographic (PDF, 1MB)
